Brand Studio Prodotto primarily works under the umbrella of stock availability reports. This tool is an artificial intelligence architecture that extracts the activities of your brands’ products and sellers and enhances the back-office support for your business. As the stock is the key factor your business works to earn profits, that is why you can not afford to run Out of Stock anyway. This not just hampers your sales rate but also impacts your customer experience. Then what is the solution? Our exclusive tool helps you get alerts regarding your inventory available based on location, sellers, and product filling rates.
Track, Monitor and Protect Listing Through Instant Alert on Multi-channel

Our Unique Approach for Stock Availability Track Alerts
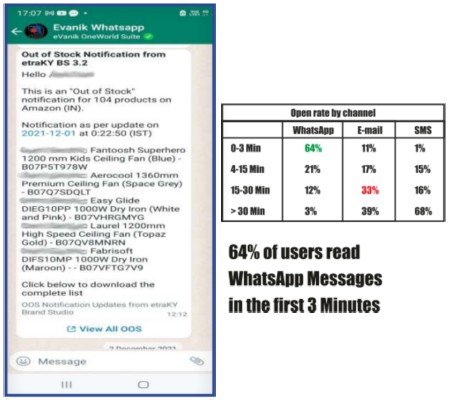
WhatsApp Instant Notification

Global-Metrics
Features Our Brand Studios’ “Prodotto” Provides
Out of Stock is the major distraction for your customers to move from your brand to another for their purchase. That is why we bring you real-time notifications regarding your products’ fill rates and the supplies to your sellers. We include information such as products’ demand rate, supply rate, sellers’ live product, product OOS status, etc. The image clarifies the area of opportunities by tracking the sellers’ location and rectifying which geographical area demands what amount of stock for effective selling management. Our reports help in effective inventory distribution and hence reduce inventory wastage.
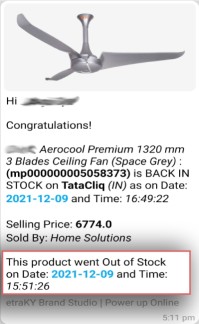
This report has a section called “Back in Stock” that gives detailed information about which product was OOS and when it was again refilled for such sellers. This record is important for you to control your demands and supplies and always be available for your target customers who may search on different websites like Amazon, Snapdeal, Myntra for your product. We are sure you won’t like to disappoint them every time. Including this, you may also require alerts about which products again are on the availability list.
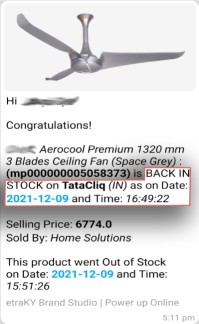
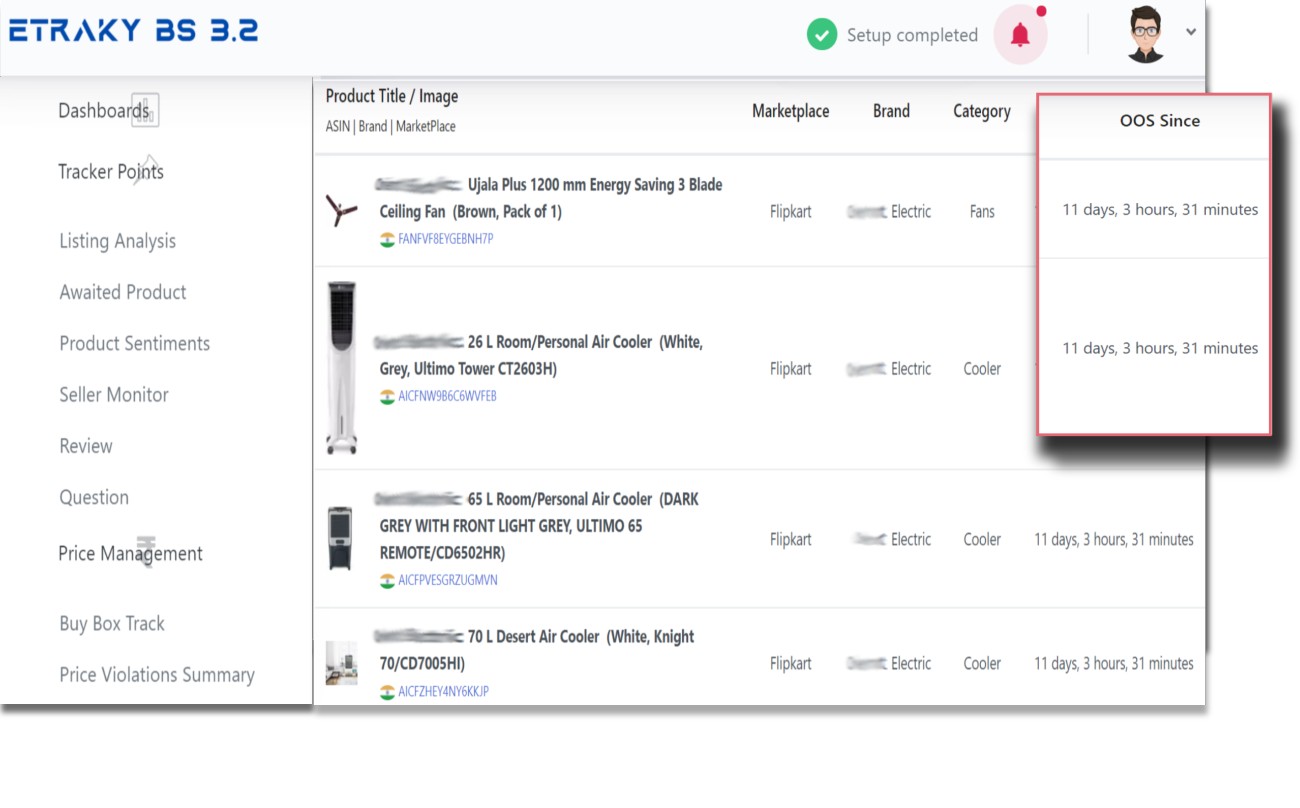
Here, historical trends viewing means the reports provided based on stock availability status that includes time and date when the stock went Out of Stock. Our report deals with the total product tracked, syncs this month, average OOS record, and the percentage rate of OOS status in the past which enables better stock status analysis and helps you make better operational decisions. In this case, sellers play a vital role because they may be neglecting the availability of stock. The reason is their fewer commission margins, unresponsive behavior, or less demand for those products.
As the term sounds, some sellers who are not authorized by the brands also operate in the market on the backfoot and take away your products’ Buy Box Button opportunities through selling your products’ duplicates. This hijacker not only hijacks this but also hampers your standards by snatching the customers from you as well. This is an injustice for those sellers who would be following brands’ MOP and gets lesser customer attention resulting in overstocking of their products. This is why we dig out such unauthorized thieves who are disturbing your business environment and doing indiscipline activities for your brands’ product. This report includes not just names of such sellers but also their location, SKUs, and prices on which they are dealing. Hence, you can stop them as per your actions.
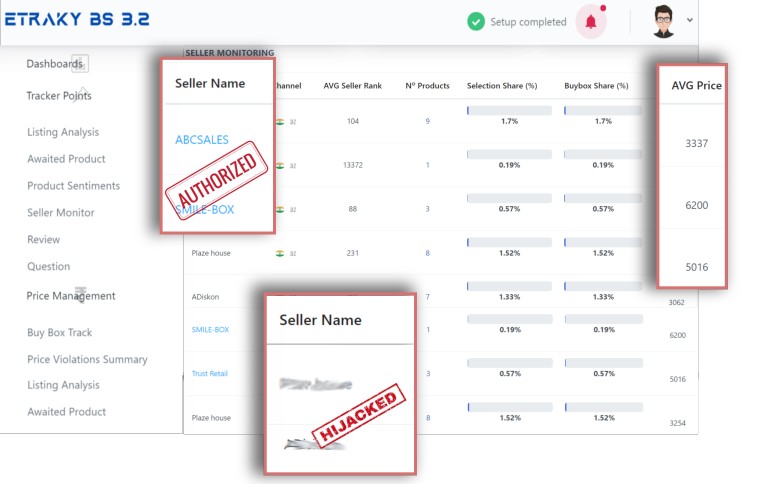
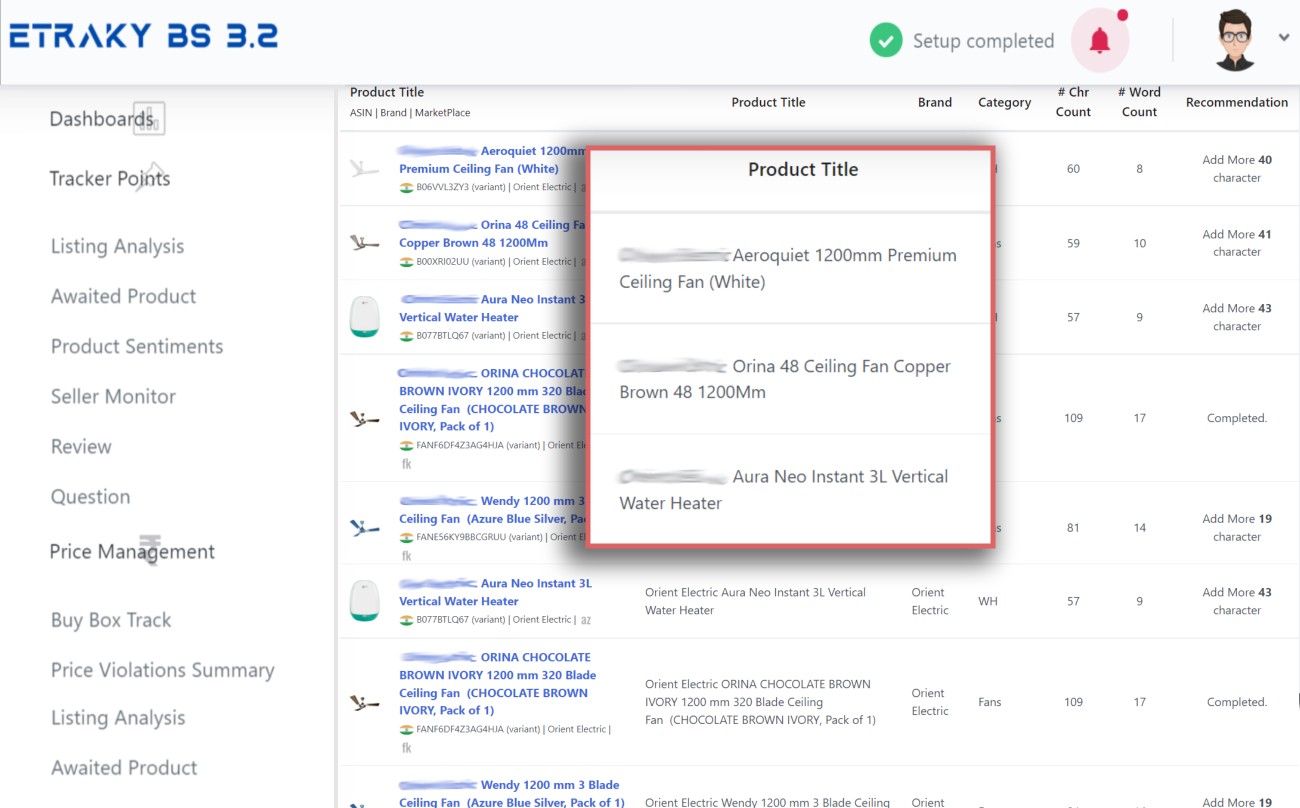
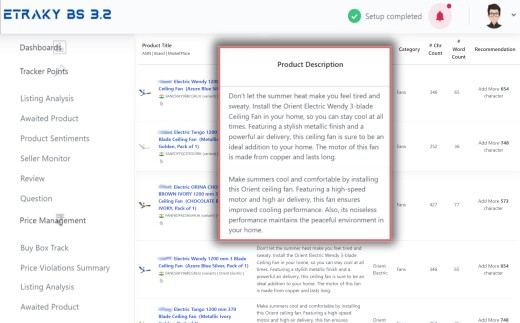
Seller-wise Availability gives a live report on what is the fill rates and how much the seller procure inventory for that specific area in an eCommerce platform. Sometimes, a few sellers have a habit of not acknowledging the lack of inventory and hence lose potential customers. But this eventually leads to a lower sales graph and customer sentiments. Hence, we assure with our reports to alert you regarding such sellers through tracking themes on the basis of the geographical area they are operating and let you meet each demand of the customers.

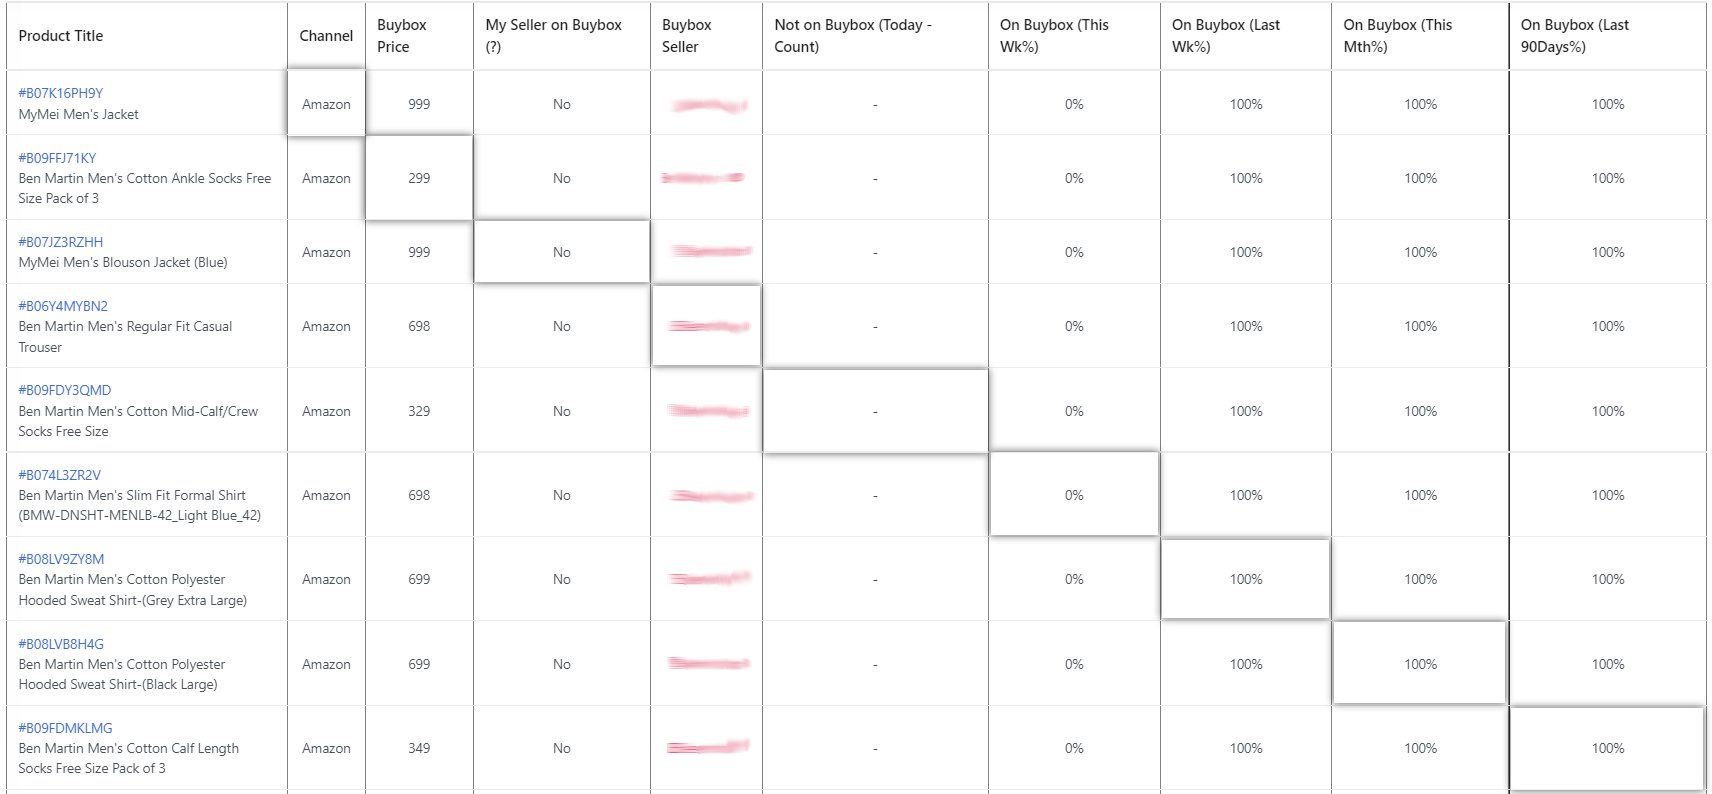
With our live reports, you will not only have an eye on your business activities but also your competitors operating in the same eCommerce channel such as Meesho, BigBasket, Grofers, etc. As you can see, our reports show you the seller on the Buy Box Button that could be your seller or your competitor. When and how many times have you had OOS status till date and what is your competitors’ fluctuation rate in the same. Basically, it gives you an idea about your inventory management efficiency and sellers’ performance regarding sales as compared to overall marketplaces.
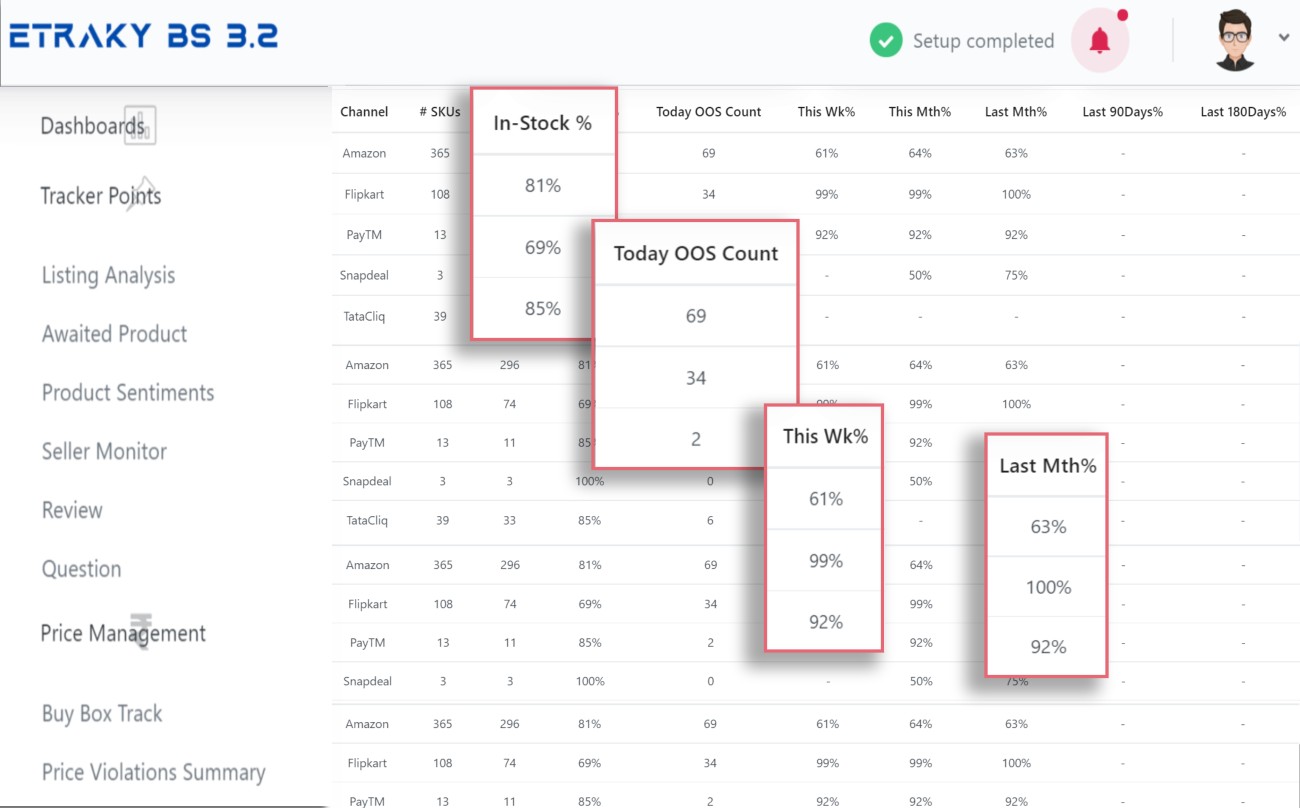
In this feature, you may find different sections telling you about your inventory availability as per each week of the month. These reports will show your inventory status in the 1st week, 2nd week, 3rd week, and last weeks’ stock status. It is primarily so because you can make a good analysis on your fill-rates in different geographical areas for different products at different times. Our report includes on which channel each SKUs have been live and had what percentage of in stock. Also, it covers details on current and past 90-180 days of OOS tracking. You may get an analysis through the analytics about how you have performed cumulatively in that month also. Hence, this observation is better to be built to avoid unaffordable losses.
We believe to be a master in providing instant business tracking reports because we work for not just tracking your stock availability but enhancing your efficiency in case of customer experience and SERP ranking also. As you know, if the customer will always find your product in OOS status, they may switch their purchase interest to any other brand. This gradually will lower the ranking which we would never let happen. We make sure of a granular-level distribution of your products. Hence, be wiser and faster in your method through our tool and grab the best out of it on any eCommerce platform.


